AI sales forecasting for distributors
AI sales forecasting uses your past sales by dealer, item and month to estimate what is likely to sell next, which helps a distributor plan purchases, targets and visits, as long as people adjust it for what the data cannot know.
- Distributors and stockists
- Owners setting dealer targets
- Sales managers
- Purchase teams placing principal orders
- FMCG, paint and building material trade

On this page 12
What a distributor actually needs to forecast
A single company-wide sales number is of little use. Distributors plan at a finer level:
- By item or stock group, to place purchase orders with principals.
- By dealer, to set targets and spot dealers who are slowing down.
- By salesperson or route, to plan visits and incentives.
- By month or week, to match stock and cash to the season.
AI earns its keep by doing this across hundreds of dealers and items at once, which no spreadsheet does easily.
How the forecast is built
- History: at least two years of sales by dealer, item and month, so seasons repeat at least once.
- Base level: recent average sales for each dealer and item.
- Trend: is the dealer growing or shrinking over the last few quarters?
- Seasonality: festive months, wedding season, monsoon, financial year-end pushes.
- Known events: a price increase, a new scheme, a new principal, a dealer who has closed. These are added by people.
Worked example
A paint distributor looks at one dealer's monthly sales of interior emulsion:
| Month | Last year | This year |
|---|---|---|
| July | ₹2,10,000 | ₹2,40,000 |
| August | ₹2,30,000 | ₹2,60,000 |
| September | ₹3,60,000 | ₹4,05,000 |
| October | ₹5,20,000 | ? |
This year is running about 13% above last year, and October last year was the festive peak. A simple forecast puts October around ₹5,85,000. The salesperson knows a competitor shop opened next door in September, so the team lowers it to ₹5,20,000 and plans stock accordingly. This mix, the machine's pattern plus the person's local knowledge, is the point.
Signals worth more than the forecast
Often the most useful output is not the forecast itself but the exceptions it reveals:
- Dealers whose last three months are well below the same months last year.
- Items that used to sell steadily and have dropped to near zero.
- Dealers buying fewer product lines than before, a sign they are sourcing elsewhere.
- Routes where order frequency has fallen even though order size has not.
These feed straight into visit plans and conversations. See measuring salesperson performance and sales beat planning.
Getting the data ready
Most forecasting problems are data problems. Before trusting any forecast, check:
- One ledger per dealer. Merge duplicates such as “Sharma Traders” and “Sharma Trading Co.” so history is not split.
- One item master per product. The same SKU entered under two names halves each one's history.
- Returns and credit notes entered. Otherwise gross sales overstate what dealers really kept.
- Stock groups that match how you plan. If you buy by brand and pack size, group items that way.
- Salesperson tagged on sales. Through cost centres or a field on the voucher, so forecasts can roll up by route.
An afternoon spent cleaning masters often improves a forecast more than any change of tool. See preparing business data for AI.
Prompts to try
- “For each dealer, compare sales in the last three months with the same three months last year, and list those down more than 20%.”
- “Which items did Agarwal Traders buy every month last year but have not bought in the last 60 days?”
- “Estimate next month's sales by stock group using the last two years, and show the range, not just one number.”
Where forecasts fail
- Too little history. One year cannot separate trend from season.
- Dirty dealer data. The same dealer under two ledger names splits its history in half.
- Schemes and price changes. A quarter-end scheme pulls sales forward; the forecast then expects that bump every quarter.
- Supply shortages. If an item was out of stock, low sales reflect supply, not demand.
- Events. Elections, floods, a principal changing its distributor network: no model sees these coming.
Review forecast against actual every month. The gap tells you how much to trust the next one.
Sales data from Tally with Cashflow OS
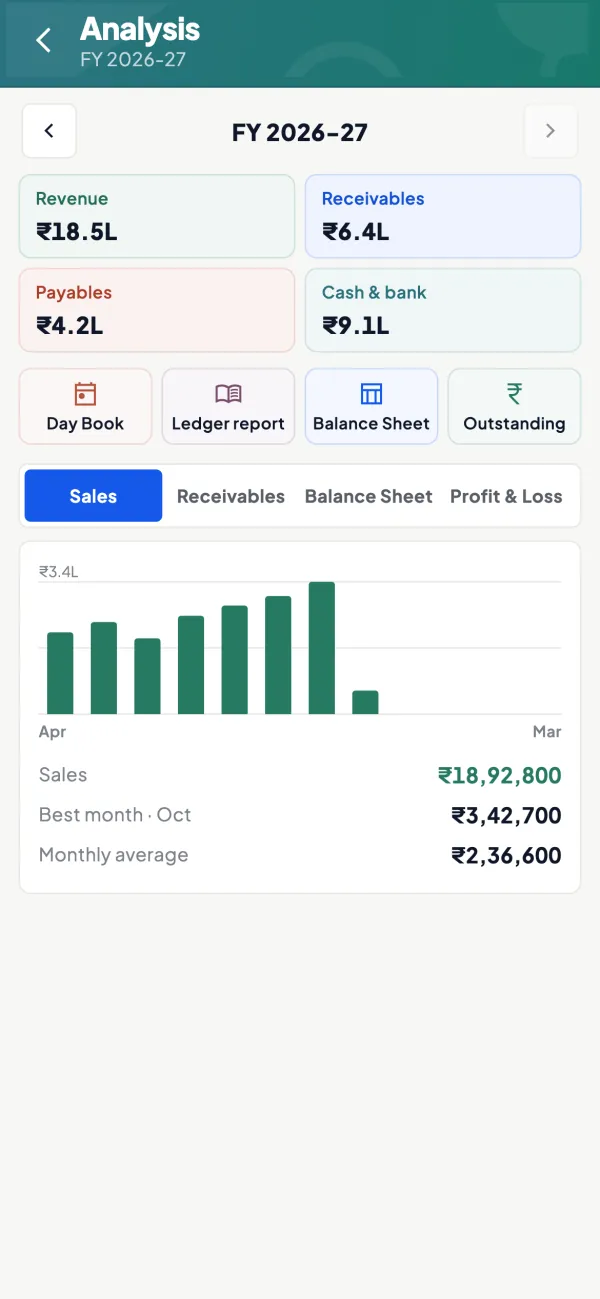
For distributors on TallyPrime, Cashflow OS brings sales by customer, item and period onto the phone and web, including top customers and reports across financial years. Its AI assistant answers questions from that synced data, such as which dealers are down on last year. With the field force add-on, owners also see visits and a performance view for each salesperson. Forecast numbers remain estimates for your team to adjust.
Avoid these
Common mistakes
- MistakeForecasting from one year of historyDo this instead
Use at least two years of monthly sales so each season has been seen once and trend can be told apart from season.
- MistakeKeeping the same dealer under two ledger namesDo this instead
Merge duplicate dealer ledgers and item masters before forecasting, so history is not split in half.
- MistakeExpecting a quarter-end scheme bump every quarterDo this instead
Mark scheme months and price changes so the forecast does not treat one-off pushes as normal demand.
- MistakeSetting targets straight from the forecastDo this instead
Use it as a starting point and adjust with the sales team's local knowledge, such as a new competitor nearby.
Keep handy
Checklist
AI sales forecasting for distributors — 7 checks. Tick them as you go.
In Cashflow OS
How Cashflow OS helps
Cashflow OS puts your TallyPrime books on every phone in the team. Where it fits this topic:
Sales by dealer, item and period
Sales by customer, item and period synced from Tally, including top customers and reports across financial years; the AI assistant can list dealers down on last year.
See AI assistant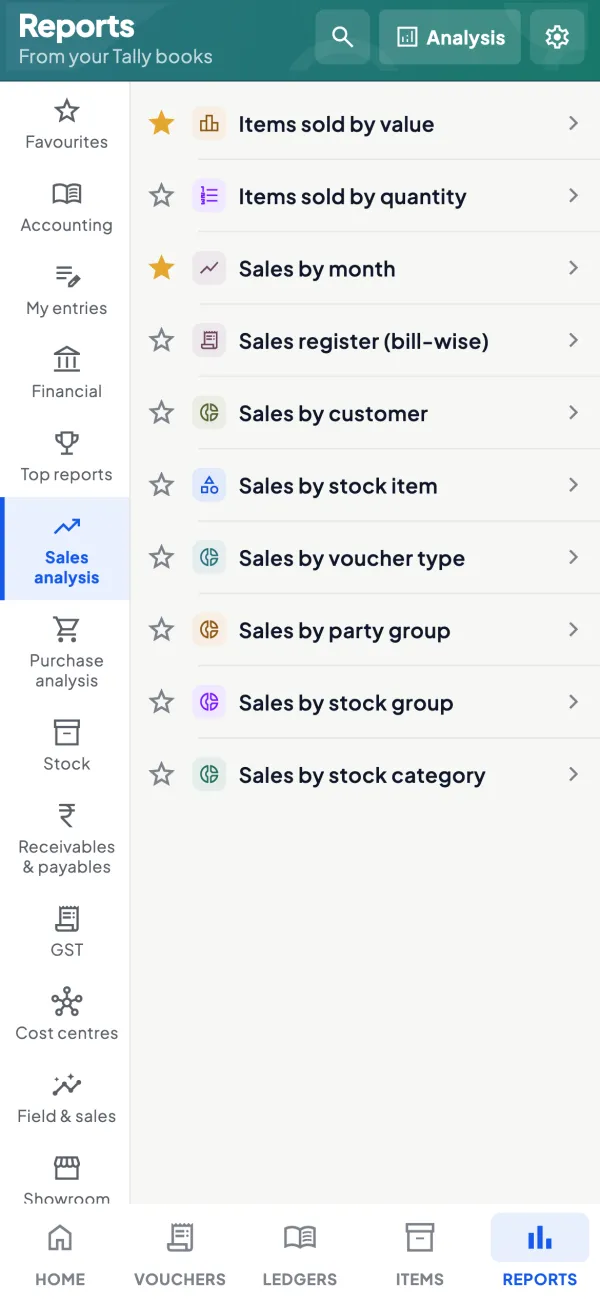
Visits and salesperson performance
With the field force module, owners see visits, route plans and a performance view for each salesperson, to act on the dealers the forecast flags.
See Field force tracking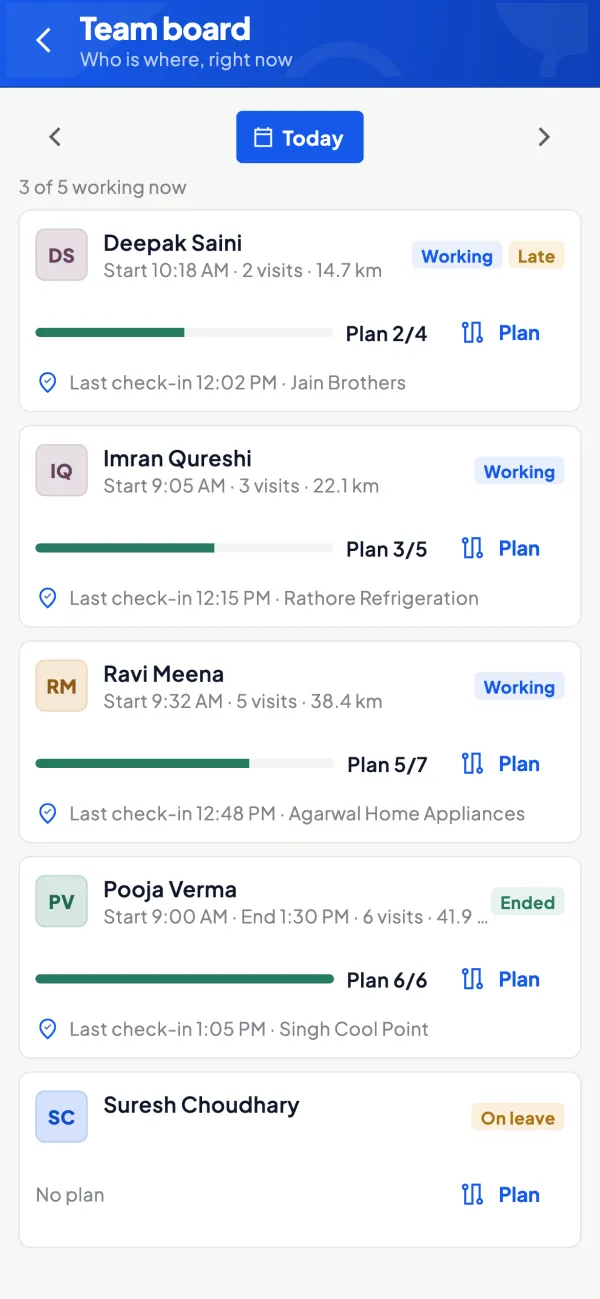
Questions people ask
How much history do I need for a useful sales forecast?
Should targets be set from AI forecasts?
Can AI forecast sales for a new product?
What should I do when a principal's target differs from my forecast?
What is seasonality in a sales forecast?
How do I spot a dealer who is buying elsewhere?
Does an out-of-stock period spoil the forecast?
Which questions should a distributor ask an AI about sales?
This page is general information for Indian businesses, not tax, legal or financial advice. Rules and rates change — check the official portals or your CA before acting.